Restaurant CEO Pay and Performance
2020 has been an incredibly tumultuous year within the restaurant industry. Due to the pandemic, the industry has seen closures, bankruptcies, acquisitions, and a complete shift in the way guests interact with restaurants. This year will be a watershed moment for every CEO and very well could determine the future of their businesses and careers. However, this article focuses on 2019 compensation packages and 2020 compensation data will be analysed next year.
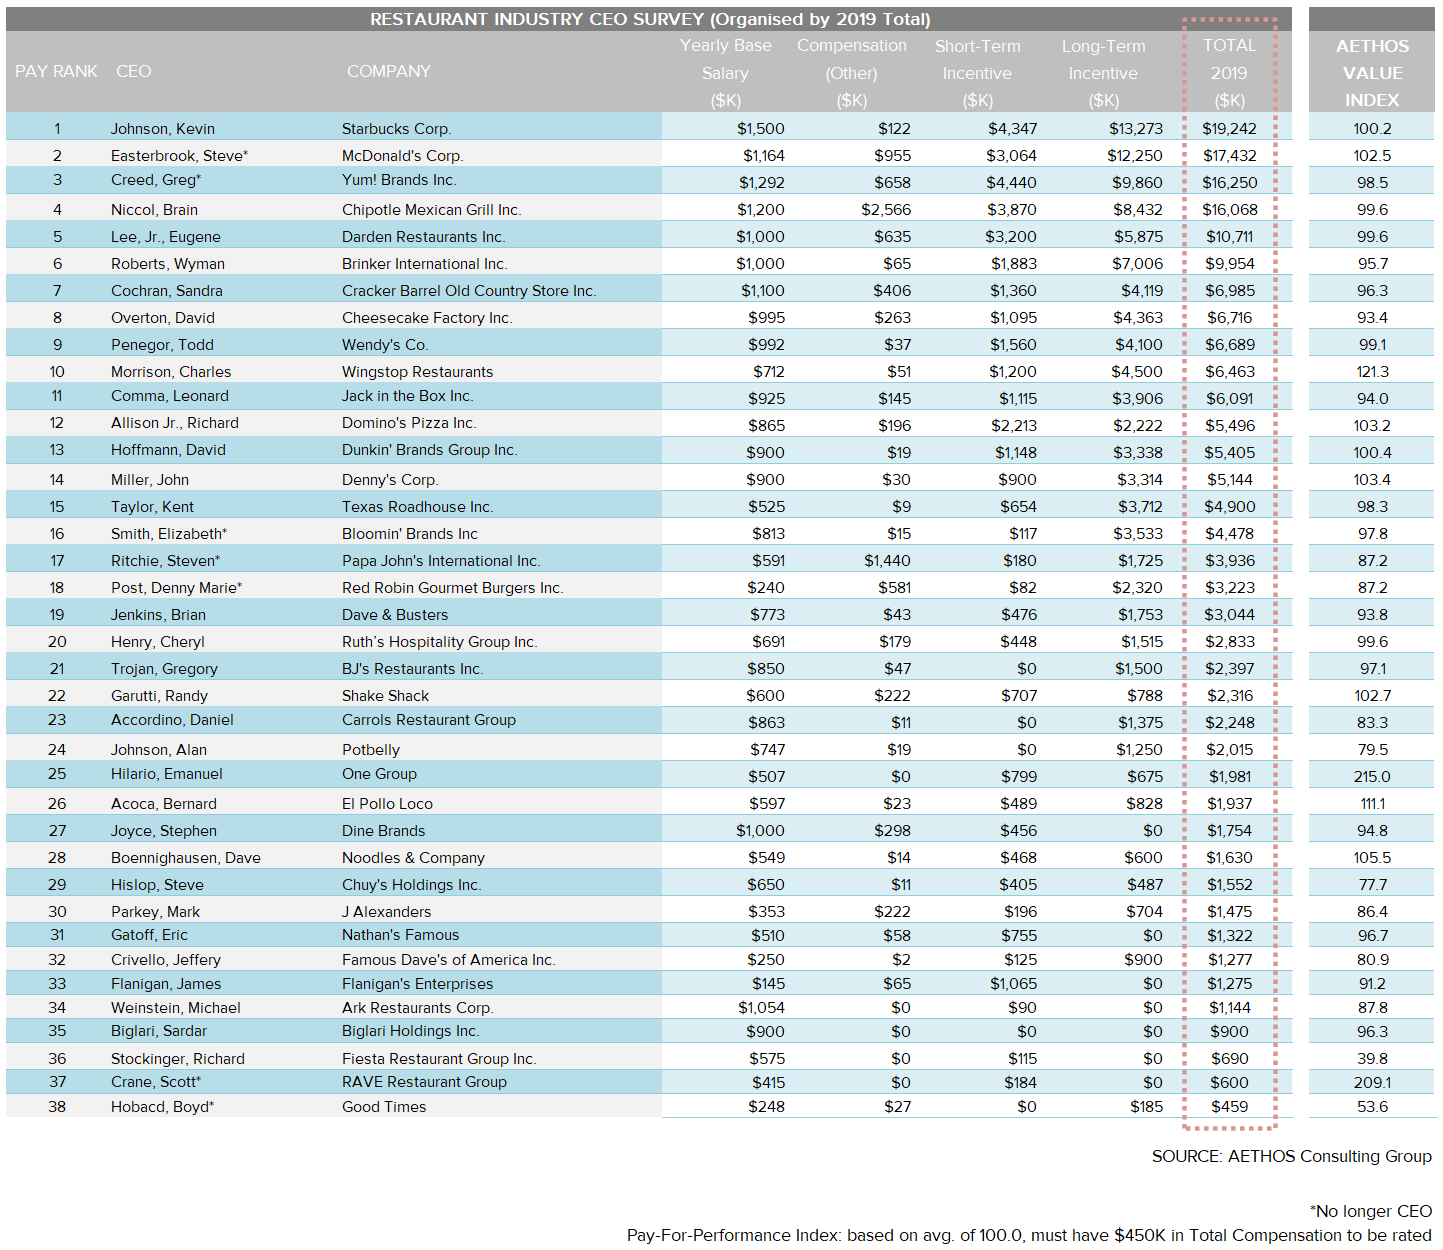
What we have found over the twenty-plus years of studying CEO pay, is that public boards are still challenged with linking CEO pay to company performance. In fact, that was the impetus for creating our pay-for-performance model. The compensation data in this article is from fiscal year 2019 and pulled from the most recent Proxy Statement. The Aethos™ Pay-for-Performance Model analyses key financial metrics such as market capitalization, stock appreciation, EBITDA growth, and compares that to compensation over a three-year time horizon. This year’s top performing CEO was Emmanuel Hilario of One Group Hospitality, leading the field with an Aethos™ Value Index (AVI) of 200 – with 100 being the mean. Charles Morrison of Wingstop Restaurants and Bernard Acoca at El Poco Loco rounded out the top three with AVI scores of 190 and 170, respectfully.

When it came to total compensation, the big got even bigger, with the same five CEOs having the largest total compensation packages. Kevin Johnson of Starbucks had the largest pay package at USD $19,241,950. Steve Easterbrook of McDonalds, Greg Creed of Yum! Brands Brian Niccol of Chipotle Mexican Grill and Eugene Lee of Darden Restaurants round out the top five and were the only restaurant CEOs with 8-figure packages. Both Mr. Easterbrook and Mr. Creed left their positions near the start of 2020 for vastly different reasons; Mr. Creed had a planned retirement while Mr. Easterbrook was removed for impropriety. Interestingly, all five of the top earners had an AVI near 100, suggesting they earned their big pay-checks.
Kevin Johnson of Starbucks led the group in both salary and long-term incentives (LTIP) with a salary of nearly USD $1.5 million and USD $13.3 million in LTIP. Greg Creed had the largest bonus and the second highest salary earning a USD $4.44 million bonus and nearly USD $1.3 million in salary. The average package for a restaurant CEO increased from USD $4.70 million to USD $4.95 million over the last year, with average salary increasing from USD $733,00 USD to $763,000. We were surprised to see the pay mix change with long-term incentives decreasing by 4 percentage points as a proportion of the total package from USD $2.96 million to USD $2.94 million, while average cash bonuses increased from USD $816,000 to USD $1.03 million – or an increase of 3.5% of the total package.
Next year’s study will be most interesting as we look at which companies adapted and even thrived during the pandemic. The quick service concepts certainly appear to have a leg up on their “dine-in” brethren. The companies that were well capitalized, survived. In contrast, twelve restaurant companies including Chuck E. Cheese, Le Pain Quotidien and California Pizza Kitchen filed for bankruptcy in 2020. Another factor was location. Mall locations were at a significant disadvantage to stand alone stores in terms of drive-up, walk-in and delivery customers. Finally, technology and digital capabilities have played a significant role in who is thriving and who is dying.
Aethos™ Pay-for-Performance Model
The Aethos™ Pay-for-Performance Model quantifies the performance of a given chief executive relative to his or her peers. The Model incorporates standard business indicators. The simplified formula is:
Aethos™ Value Index© = (M + S + E ) / C
Where: Market Complexity Factor (M); the M Factor quantifies the complexity differential of running a large cap versus a small cap company. Stock Appreciation Factor (S); the S Factor measures stock appreciation compared to the peer group over a given period. EBITDA Growth Factor (E); the E Factor measures EBITDA growth compared to the peer group over a given period. Compensation Benchmark (C); the C Factor quantifies the degree to which a chief executive over or under earns his peer group. Compensation includes base salary, short-term incentives long-term incentives and other compensation as required by SEC regulations.
Copyright ã K. Kefgen 1994-2020. Confidential and Proprietary. Not for Publication, All Rights Reserved.
