Gaming CEO Pay, Calm Before the Storm
As first published in the Casino Journal, October 2020
The end of 2019 ushered in a banner year. Valuations where high and deals were getting done (Penn National & BarStool, Caesars & Eldorado) among them. Then the world changed overnight. Panic in the public markets ensued and valuations plummeted (Penn National went from $49 to $4 in March). The gaming compensation committees had the challenge of paying 2019 bonuses and such just as COVID was devastating their businesses. A though spot to say the least. Markets have since bounced back and casinos are slowing reopening to a new reality. How gaming companies handle executive pay issues at the end of 2020 will be a very interesting read.
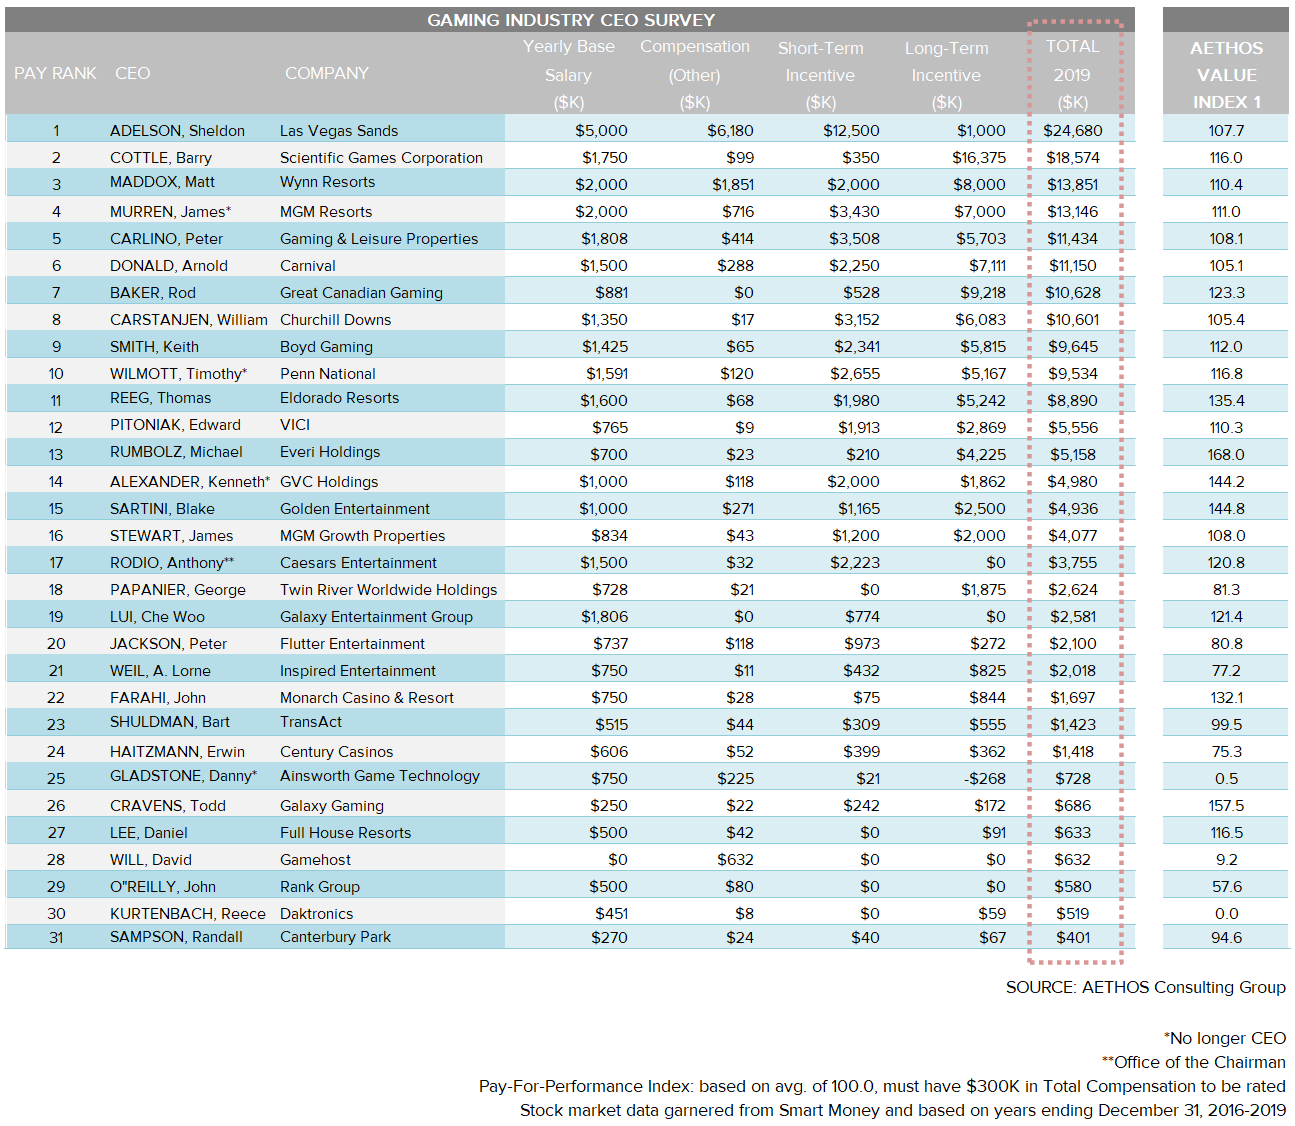
In the meantime, we review proxy statements this summer to evaluate gaming CEO pay in our fourteenth annual study. The goal is to determine whether a CEO gave shareholders value for their pay check. The Aethos™ pay-for-performance model compares significant financial metrics such as company size (market cap), stock appreciation (rise in stock price from 2016-19), EBITDA growth (2016-19), and total direct compensation (combination of salary, bonus, LTIP & other). Our findings are illustrated below.

Market capitalization tends to dictate company complexity and likewise, CEO pay. Generally, the bigger the company, the bigger the pay check. Sheldon Adelson at Las Vegas Sands was the highest paid CEO in the industry at USD $24.7M in total compensation. LVS also dwarfs their competitors in market cap. The top ten highest paid gaming CEO all made over USD $10M in total compensation and 24 of the 31 CEOs made more than USD $1M a year. The average CEO pay check decreased over USD $1M to USD $6.1M compared to the previous year.
When it came to our pay-for-performance rating Mike Rumbolz at Everi Holding led the group with a 168 AVI (Aethos™ Value Index). In other words, Rumbolz gave Everi shareholders the best value relative to his pay check. By our calculations, Rumbolz could have been paid an additional USD $3M and still been appropriately compensated. Other top performers included Todd Cravens, Blake Sartini, Tom Reeg and Ken Alexander. The wealthiest CEO continue to be Che Woo Lui and Sheldon Adelson who own company stock worth billions, while Carlino, Farahi and Sartini round out the list. Interestingly, all five of these CEOs had an AVI over 100, the mean of the group. Lawrence Ho was not on this year’s list as Melco’s filings were not out in time but suspect he is still a billionaire this year.
Fourteen CEOs in the gaming industry received a base salary of greater than USD $1M. Sheldon Adelson had the largest salary at USD $5M followed by Jim Murren and Matt Maddox at USD $2M. The average salary of the group came in at just over USD $1.1M. A slight decrease over last year. In the bonus category, Sheldon Adelson led the group with a bonus of USD $12.5M followed by Peter Carlino at USD $3.5M. The average CEO bonus for the group was USD $1.5M, with five CEOs getting no bonus at all. The largest component of CEO compensation continues to be long-term incentives (LTIPs). The average LTIP value for the group was USD $3M. Barry Cottle topped this list with his USD $18.5M stock grant. Rod Baker and Matt Maddox followed with stock grants valued at nearly USD $8M. Seventeen CEOs received an equity grant worth over USD $1M, while five received nothing at all.
Pay Mix has become a hot topic as ISS and institutional investors are demanding more CEO pay be in the form of “at risk” compensation (short and long-term incentives). Experts are also demanding more performance-based metrics as part of equity grants. In the Fortune 500, at risk compensation averages 58% and has risen steadily over the last decade. In gaming that number is 51%. More scrutiny in this area can be expected as “say on pay” and other SEC requirements are implemented. As previously mentioned, 2020 has been a tumultuous year and it will be curious to see how CEO pay is affected by COVID and government watchdogs.
(*) The Aethos™ Value Index = (M + S + E ) / C
- Market Complexity Factor (M): The M Factor quantifies the complexity differential of running a large cap versus a small cap company. It is calculated by comparing the market capitalization of the subject company to the average market capitalization of the peer group.
- Stock Appreciation Factor (S): The S Factor measures stock appreciation. It is calculated by comparing the stock appreciation of the subject company to the average stock appreciation of the peer group over a given period of time.
- EBITDA Growth Factor (E): The E Factor measures EBITDA growth. It is calculated by comparing the EBITDA growth of the subject company to the average EBITDA growth of the peer group over a given period of time.
- Compensation Benchmark (C): The C Factor quantifies the degree to which a chief executive over or under earns his peer group. Compensation includes base salary, short-term incentives long-term incentives and other compensation as required by SEC regulations. Stock options are valued using the Black-Scholes valuation model. The C Factor is calculated by comparing the total compensation of the subject executive with the average total compensation of the peer group.
